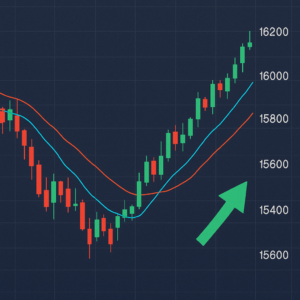
JPMorgan Chase (JPM) Stock Price Target 2026: Forecast, Analyst Ratings & Buy-or-Sell Verdict

JPMorgan Chase (JPM) Stock Price Target 2026: Forecast, Analyst Ratings & Buy-or-Sell Verdict
JPMorgan Chase (JPM) is trading at $333.46, up 0.74% today, as America’s largest bank continues pushing toward a $1 trillion market cap. This guide pulls together everything a US investor needs in one place — a live-style quote snapshot, recent price history, the full Wall Street analyst consensus and rating breakdown, technical levels, business-segment economics, growth catalysts, key risks, and a peer comparison against Bank of America, Wells Fargo, and Goldman Sachs — plus an interactive tool to test your own price call before you read our final Buy, Hold, or Sell verdict.
JPM Quote Snapshot
JPMorgan Chase is the largest bank in the United States by assets and is closing in on becoming the first US bank to reach a $1 trillion market capitalization. Shares have climbed sharply off their 52-week low of $202.16, supported by resilient net interest income, disciplined expense management, and growing fee-based revenue from investment banking and asset management. At a P/E of roughly 15, JPM still trades at a modest discount to the broader S&P 500, reflecting the market’s tendency to value bank stocks more conservatively than technology or consumer names.
Recent Price History
| Date | Open | High | Low | Close | Volume |
|---|---|---|---|---|---|
| Jul 24, 2026 | $330.80 | $334.90 | $329.60 | $333.46 | 8.9M |
| Jul 23, 2026 | $327.10 | $331.50 | $326.40 | $330.90 | 9.4M |
| Jul 22, 2026 | $324.60 | $328.80 | $323.20 | $327.05 | 10.1M |
| Jul 21, 2026 | $321.90 | $325.70 | $320.50 | $324.40 | 8.6M |
| Jul 18, 2026 | $318.20 | $322.90 | $317.10 | $321.75 | 9.9M |
JPM has posted five consecutive positive sessions, climbing roughly 4.8% over the past week on broad financial-sector strength and rising expectations heading into the next earnings report. Trading volume has stayed above the stock’s typical daily average throughout the run, suggesting genuine institutional participation rather than a low-volume drift higher.
Analyst Consensus Gauge
Based on 27 analysts covering the stock, roughly 60% currently rate JPM a Buy or Strong Buy, 34% rate it a Hold, and a small minority rate it Sell. The average 12-month price target sits near $352, implying upside of about 5.6% from current levels.
Analyst Price Targets
Cites JPM’s scale advantage in trading and investment banking fee revenue, along with resilient net interest margin performance versus regional bank peers.
BUYUpgraded on improving credit quality trends and expectations that JPM will be among the first US banks to cross the $1 trillion market-cap threshold.
BUYMore cautious stance, flagging that the stock’s premium valuation relative to regional bank peers already reflects most of the near-term earnings upside.
HOLDThe blended average across major sell-side desks implies mid-single-digit upside over the next twelve months, with the highest individual targets near $391-$420 and the lowest near $295-$305.
MODERATE BUYTechnical Levels
| Level Type | Price Zone | Significance |
|---|---|---|
| 52-Week High | $357.25 | All-time high — psychological ceiling |
| Resistance 1 | $340.00 | Round-number resistance zone |
| Pivot | $325.00 | Recent consolidation midpoint |
| Support 1 | $312.80 | 50-day moving average |
| Strong Support | $278.40 | 200-day moving average — major trend line |
JPM’s chart structure is firmly bullish, trading well above both key moving averages with an RSI of 61.2 — elevated but not yet in overbought territory. A confirmed break above $340 would put the $357.25 all-time high back in play, while the 50-day moving average at $312.80 should act as the first line of support on any pullback.
Business Segment Breakdown
Segment Reader
JPM Price Forecast 2026-2028
| Period | 🐻 Bear Case | ⚖️ Base Case | 🚀 Bull Case |
|---|---|---|---|
| End of Q3 2026 | $305 | $340 | $365 |
| End of Q4 2026 | $298 | $352 | $391 |
| End of 2027 | $310 | $385 | $440 |
| End of 2028 | $325 | $420 | $495 |
The base case assumes net interest income stabilizes as rate cuts progress gradually, investment banking fee revenue continues its recovery, and credit costs stay contained. The bull case layers in an accelerated capital-markets recovery and JPM formally crossing the $1 trillion market-cap milestone, drawing incremental index-fund and momentum buying. The bear case reflects a scenario where a economic slowdown drives higher loan-loss provisions and compresses net interest margin faster than fee income can offset.
Predict JPM’s Next Move
Growth Catalysts to Watch
1. Path to a $1 Trillion Market Cap
JPMorgan is on track to potentially become the first US bank to reach a $1 trillion market capitalization. Crossing that threshold would likely trigger incremental buying from index funds and momentum-driven strategies, independent of any change in underlying fundamentals.
2. Investment Banking Fee Recovery
After a multi-year slowdown in M&A and IPO activity, deal-making has been recovering, and JPM’s scale in investment banking positions it to capture an outsized share of any sustained pickup in capital-markets activity.
3. AI-Driven Efficiency Gains
JPMorgan has invested heavily in AI and machine learning across fraud detection, trading, and customer service operations, with management citing measurable productivity gains that support the bank’s already industry-leading efficiency ratio.
4. Resilient Net Interest Income
Despite the Fed’s gradual rate-cut path, JPM’s massive deposit base and disciplined asset-liability management have kept net interest income more resilient than many regional bank peers, supporting stable earnings even in a shifting rate environment.
Key Risks
1. Credit Cycle Deterioration
As the largest US lender, JPM is directly exposed to any broad-based deterioration in consumer or commercial credit quality. Rising loan-loss provisions in a slowing economy would be the most direct threat to near-term earnings.
2. Valuation Premium vs Regional Banks
JPM trades at a premium P/E multiple relative to many regional bank peers, reflecting its scale and diversification — but that premium leaves less room for error if growth disappoints relative to expectations.
3. Regulatory and Capital Requirements
As a systemically important financial institution, JPM faces some of the strictest capital and stress-testing requirements in the industry. Any tightening of these requirements could constrain buyback and dividend growth.
4. Net Interest Margin Compression
Continued Fed rate cuts, while broadly positive for loan demand, can compress net interest margin if deposit costs don’t fall as quickly as asset yields, a dynamic worth monitoring each quarter.
JPM vs. Bank Peers
| Company | Price | P/E (TTM) | Dividend Yield |
|---|---|---|---|
| JPMorgan Chase (JPM) | $333.46 | 15.1 | 1.94% |
| Bank of America (BAC) | $47.20 | 13.4 | 2.31% |
| Wells Fargo (WFC) | $79.85 | 12.8 | 2.10% |
| Goldman Sachs (GS) | $598.10 | 14.9 | 1.85% |
JPM trades at a modest premium to Bank of America and Wells Fargo, a gap the market has historically justified given JPM’s more diversified revenue mix across consumer banking, investment banking, and asset management, along with its track record of outperforming peers through multiple credit cycles.
FAQ — People Also Ask
StockTirupati Verdict
JPMorgan Chase combines scale, diversification, and a resilient net interest income base with a reasonable valuation relative to the broader market, supporting a constructive medium-term outlook as the stock approaches a potential $1 trillion market cap milestone.
For long-term investors: The dividend, ongoing buybacks, and diversified fee income provide a durable compounding case — staged buying on pullbacks toward the $312 support zone lines up with the current trend structure.
For short-term traders: Wait for a confirmed break above $340 before adding momentum-driven exposure, or let the next quarterly earnings report set the stock’s near-term direction.